Graph window
Examples of graphs
Graph types:
In a graph window, you can show the following types of graphs:
- Graphs from Columns, i.e. distinct values available in columns of a table; the graph can be shown in a number of manners:
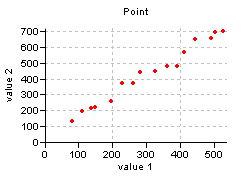
- as points: also know as a scatter gram:
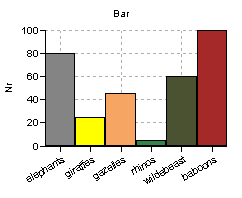
- as bars: also known as a bar chart:
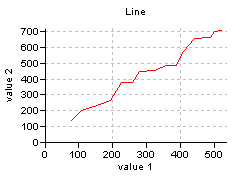
- as a line: connecting the successive distinct Y-values by the shortest possible line:
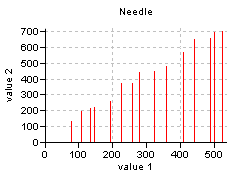
- as needles: vertical lines from the X-axis to each distinct Y-value:
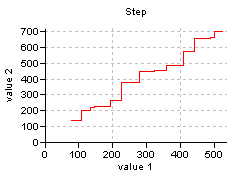
- as steps: connecting successive distinct Y-values by a horizontal + vertical line:
- Graphs from Formula, i.e. a continuous line showing a Y-value for every X-value according to a completely user-defined function:

- Least Squares Fit, i.e. a continuous line displaying the best fit through distinct points according using a certain user-selected function while coefficients are calculated by the program:

- Semi-variogram Models, to find the best line through experimental semi-variogram values (distance values h against semi-variogram values g):

- Rose diagrams, to plot directions against a Y-value:

Tips:
- In a graph window, you can display multiple Graphs from Columns together with multiple Graphs from Formula, Graphs by Least Squares Fit, and/or Semi-variogram Models.
- A rose diagram can only be displayed together with other rose diagrams.
Axis types:
When using a value column for an axis, you can choose, for X-axis, left Y-axis, and right Y-axis, to use a Linear axis, a Logarithmic axis or a Normal Probability axis.
Examples of different types of X-axes are shown below.
See also:


