Name:
Optionally, modify the name of this semi-variogram model. The name of the graph layer is visible in the Graph Management pane and in the legend of the graph window.
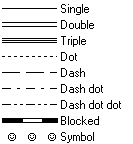
Line type:
Select a line type in which the semi-variogram model should be displayed.

Color:
Select a color with which the graph should be displayed.
To define your own color, click the little create button or select the 'Custom' item at the bottom of the list; then, the Windows Color dialog box will appear.
Support line:
For line types Single, Dot, Dash, Dash Dot, Dash Dot Dot and Symbol:
- Select this check box when an extra support line should be drawn below the selected line type. Subsequently, specify the color of the support line in the Background Color list box in this dialog box.
- Clear this check box when the line should be drawn in a single color.
Background color:
When a support line is specified for line types Single, Dot, Dash, Dash Dot, Dash Dot Dot or Symbol: select an extra color for the support line.
For line types Double, Triple or Blocked, select an extra color for the inner part of a double, triple or blocked line.
Line width (mm):
Specify the line width (mm) with which the graph should be drawn in the graph window and in which the graph should be printed.
- When you accept the default line width of 0.0, the line will be drawn as fine as possible (hair line), i.e using a width of 1 pixel on the screen, and a width of 1 dot on a printer.
- When a support line is specified, this option refers to the line width of the support line; the selected line type will be drawn as fine as possible.
Block distance (mm):
For line type Blocked:
Type a value for the distance between the blocks (mm).
![]()
For line type Symbol:
Click the Symbol button to select a symbol, a symbol size, and a rotation. You can use simple symbols or a symbol from any installed symbol font. The Line Symbols dialog box will appear.
Symbol distance (mm):
For line type Symbol:
Specify a value for the distance between the symbols.
Semi-variogram:
Choose a model which fits your experimental semi-variogram values and which later on can be used in the Kriging operation to calculate the values for the semi-variogram function g(h). You can choose between the Spherical model, Exponential model, Gaussian model, Wave model, Rational Quadratic model, Circular model, or the Power model. For more information on the mathematical formulae of the models, see Formulae of semi-variogram models.
Nugget:
When you found a nugget effect, specify the value. A nugget effect is the vertical jump from value 0 at the origin, to the semi-variogram value at extremely small separation distances. You are specifying parameter 'C0' for the selected model.
Sill:
Type a value for the sill; the sill is the plateau that the semi-variogram values reach at the range. You are specifying parameter 'C0 + C' for the selected model.
Range:
Type a value for the range; the range is the distance at which the semi-variogram values do not increase anymore and reach a plateau. You are specifying parameter 'a' for the selected model (real value > 0).
Slope:
For the Power model only: type a value for the 'slope', i.e. specify parameter 'k' for this model. When you use the Power model with a power exponent of 1, the model becomes linear (a straight sloping line); then, this 'slope' parameter equals the direction coefficient (Dg/Dh) of the line.
Power:
For the Power model only: type a real value for the power exponent, i.e. specify parameter �m� for this model. The power function is meaningful if 0 < power exponent < 2. When value 1 is used, the Power model becomes linear and the slope will be constant. If the power exponent is 2 the assumed stochastic model (�randomness�) is not always justifiable and the interpolation can become pathological.