Modify the name and/or the appearance (i.e. display options) of the selected rose diagram.
The option Rose Diagram is designed to display the output of the Segment direction histogram operation in graphical format.
This dialog box appears:
Dialog box options:
|
Name:
|
Optionally, modify the name of this rose diagram. The name of the graph layer is visible in the Graph Management pane and in the legend of the graph window.
|
|
 Line: Line:
|
Select this option to connect the value of a record (Y values) with the value of the next record through a straight line.
|
|
 Step: Step:
|
Select this option to connect the value of a record (Y values) with the value of the next record through a step-wise line.
|
|
 Needle: Needle:
|
Select this option to obtain a separate line in the rose diagram for every record (Y values) in the table. Every line will at 0,0.
|
|
Color:
|
Select a color in which the rose diagram should be displayed.
To define your own color, click the little create button or select the 'Custom' item at the bottom of the list; then, the Windows Color dialog box will appear.
|
Examples:
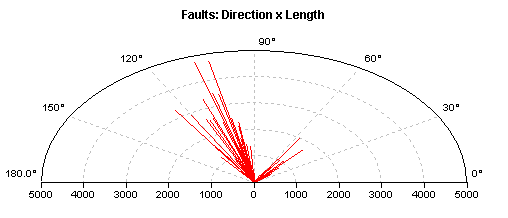
Figure 1 below shows a rose diagram of the Faults in segment map Faults of the example data. The X-axis shows the direction of the Fault segments, the Y-axis show the length of these segments in a certain direction.

Fig. 1: Rose diagram showing directions and lengths of Faults. The line type of the rose diagram is Needle.
Figure 2 below shows a rose diagram of the Lineaments in segment map Faults of the example data. The X-axis shows the direction of the Lineament segments, the Y-axis show the length of these segments in a certain direction.

Fig. 2: Rose diagram showing directions and lengths of Lineaments. The line type of the rose diagram is Needle.
Tips:
See also:
Graph window : functionality
Graph window : Graph Management
Graph window : toolbar
Graph window : menu commands
Create a rose diagram (dialog box)
Add a rose diagram (dialog box)
ILWIS objects : graphs
![]() Line:
Line:![]() Step:
Step:![]() Needle:
Needle:
