The grid lines of the rose diagram can be modified in the X-axis and Y-axis dialog boxes.
The option Rose Diagram is designed to display the output of the Segment direction histogram operation in graphical format.
With the Segment direction histogram operation you can analyze the patterns of the line features in a segment map; the direction, length, and frequencies of segments without intermediate points or within segments (i.e. in between all intermediate points) are calculated.
The results of the Segment direction histogram operation are stored in a table. For a better understanding of the values, it is advised to create a rose diagram.
To create a rose diagram / this dialog box appears:
Dialog box options:
|
Table: |
Select a table which contains the columns that you wish to show as a rose diagram. |
|
Angle: |
Select column 'Direction', or select any other value column which represents angles (X-axis). Note: The column used for the X-axis of a rose diagram is supposed to contain values between 0-180° or between 0-360°. |
|
Value: |
Select either column 'Length' or column 'NrSeg', or select any other value column to be used as Y-axis. |
The rose diagram will be displayed in a new graph window.
Tips:
The grid lines of the rose diagram can be modified in the X-axis and Y-axis dialog boxes.
Examples:
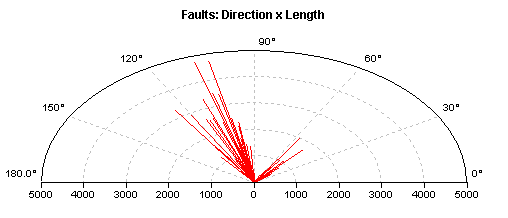
Figure 1 below shows a rose diagram of the Faults in segment map Faults of the example data. The X-axis shows the direction of the Fault segments, the Y-axis show the length of these segments in a certain direction.

Fig. 1: Rose diagram showing directions and lengths of Faults.
Figure 2 below shows a rose diagram of the Lineaments in segment map Faults of the example data. The X-axis shows the direction of the Lineament segments, the Y-axis show the length of these segments in a certain direction.

Fig. 2: Rose diagram showing directions and lengths of Lineaments.
See also:
Graph window : Graph Management
Graph Options - Rose Diagram (dialog box)