Name:
Optionally, modify the name of this graph by least squares fit. The name of the graph layer is visible in the Graph Management pane and in the legend of the graph window.
Line type:
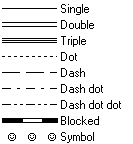
Select a line type in which the graph by least squares fit should be displayed.

Color:
Select a color with which the graph should be displayed. To define your own color, click the little create button or select the 'Custom' item at the bottom of the list; then, the Windows Color dialog box will appear.
Support line:
For line types Single, Dot, Dash, Dash Dot, Dash Dot Dot and Symbol:
- Select this check box when an extra support line should be drawn below the selected line type. Subsequently, specify the color of the support line in the Background Color list box in this dialog box.
- Clear this check box when the line should be drawn in a single color.
Background color:
When a support line is specified for line types Single, Dot, Dash, Dash Dot, Dash Dot Dot or Symbol: select an extra color for the support line.
For line types Double, Triple or Blocked, select an extra color for the inner part of a double, triple or blocked line.
Line width (mm):
Specify the line width (mm) with which the graph should be drawn in the graph window and in which the graph should be printed.
- When you accept the default line width of 0.0, the line will be drawn as fine as possible (hair line), i.e using a width of 1 pixel on the screen, and a width of 1 dot on a printer.
- When a support line is specified, this option refers to the line width of the support line; the selected line type will be drawn as fine as possible.
Block distance (mm):
For line type Blocked:
Type a value for the distance between the blocks (mm).
![]()
For line type Symbol:
Click the Symbol button to select a symbol, a symbol size, and a rotation. You can use simple symbols or a symbol from any installed symbol font. The Line Symbols dialog box will appear.
Symbol distance (mm):
For line type Symbol:
Specify a value for the distance between the symbols.
Function:
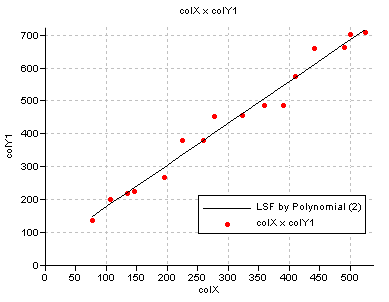
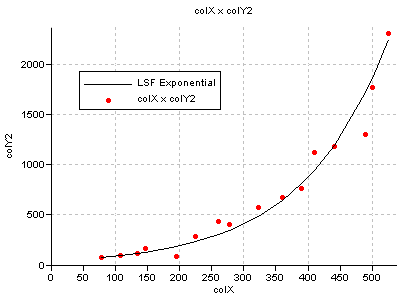
Optionally, select another function to recalculate the least squares fit. The following functions are available: Exponential, Logarithmic, Polynomial, Power Law, and Trigonometric. For more information, see the Add Graph Least Squares Fit dialog box.
Nr. of terms:
When using the Polynomial or Trigonometric function, specify the number of terms that the function should use.
Least Squares Fit equation:
View the resulting formula of the (previous) least squares fit calculation.

