Graph window |
Edit menu |
Add Graph by Least Squares Fit |
|
Perform a least squares fit, i.e. fit the best line, through values that are available in the table.
Before you can use this option, the graph window should already display a point graph of 2 value columns of a table. For more information, see Create a graph.
This dialog box appears:
Dialog box options:
|
X-column: |
Select a value column which contains the independent variable. This is the same column that is probably used for the X-values in the current point graph. |
|
Y-column: |
Select a value column which contains the dependent variable. This is the same column that is probably used for the Y-values in the current point graph. |
|
Function: |
Select a function that should be used to calculate the least squares fit. The following functions are available: Exponential, Logarithmic, Polynomial, Power Law, and Trigonometric. For more information, see below. |
|
Nr. of terms: |
When using the Polynomial or Trigonometric function, specify the number of terms that the function should use. |
The least squares fit is calculated and the result is directly shown as a line graph in the graph window.
The resulting least squares fit equation is shown in the Graph Options - Least Squares Fit dialog box.
Available functions:
|
Exponential: |
y = a * ebx |
|
Logarithmic: |
y = a * log(b* x) |
|
Polynomial: |
y = a + b* x + c* x2 + d* x3 + ... |
|
Power Law: |
y = a * xb |
|
Trigonometric: |
y = a + b * cos(x) + c * sin(x) + ... |
Examples:
Example 1:
The values of column ColX and column ColY1 are used to create a Graph from Columns (the red points in Figure 1 below). Then, by adding a Graph by Least Squares Fit, in this case using a polynomial function with 2 terms, the 'best' fit is found through these points (the black line in Figure 1 below).
The resulting formula is Y = 49.101 + 1.276 * X and can be viewed on the Graph Options - Least Squares Fit dialog box.
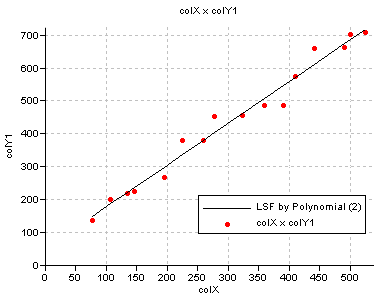
Fig. 1: A least squares fit using a polynomial function. The Least Squares Fit line is defined by Y = 49.101 + 1.276 * X
Example 2:
The values of column ColX and column ColY2 are used to create a Graph from Columns (the red points in Figure 1 below). Then, by adding a Graph by Least Squares Fit, in this case using an exponential function, the 'best' fit is found through these points (the black line in Figure 1 below).
The resulting formula is Y = 42.341302790409 * exp(0.007566547732 * X) and can be viewed on the Graph Options - Least Squares Fit dialog box.
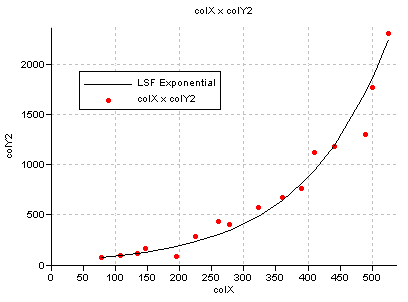
Fig. 2: A least squares fit using an exponential function. The Least Squares Fit line is defined by Y = 42.341302790409 * exp(0.007566547732 * X)
Tips:
The grid lines of the graph can be modified in the X-axis and Y-axis dialog boxes.
See also:
Graph window : Graph Management