Download and resampling of MODIS images
his article explains how to automate download, mosaicking, resampling and import of MODIS product to a GIS. We focus on the one of the most known MODIS products for terrestrial environmental applications: the Enhanced Vegetation Index (EVI), which is the improved NDVI (Huete et al., 2002; see the complete list of MODIS products). EVI corrects distortions in the reflected light caused by the particles in the air as well as the ground cover below the vegetation. The EVI also does not become saturated as easily as the NDVI when viewing rainforests and other areas with large amounts of chlorophyll. EVI can be directly related to the photosynthetic production of plants, and indirectly to the green biomass (Huete et al., 2002). By observing dynamics of EVI for an area of Earth's surface, we can infer about the vegetation dynamics within season, but also detect long-term trends and sudden changes in the biomass (e.g. due to forest fires, deforestation, urban growth and similar).
NASA's MODIS Earth observation system is today considered to be one of the richest sources of remote-sensing data for monitoring of environmental dynamics (Neteler, 2005; Lunetta et al. 2006; Ozdogana and Gutman 2008). This is due to the following reasons:
- it is global;
- it has a relatively high temporal resolution/coverage (1-2 days);
- it is open-access (see the MODIS licence specification);
- a significant work is done to filter the the original raw images for clouds and artifacts; a variety of complete MODIS products such as composite 15-day and monthly images is available at three resolutions: 250 m, 500 m and 1 km;
- efficient tools to obtain various MODIS products and import them to various GIS exist;
The importance of MODIS EVI index for environmental management and nature conservation is enormous (Lunetta et al. 2006). MODIS images can be obtained by anybody at any time and can be used as an independent source of information to prove degradation of natural systems that are possibly not visible from local sources of information. MODIS EVI images can be used to prove changes in land cover, deforestation, damages caused by global warming or even fine long-term succession processes. Because MODIS EVI is available from year 2000, anybody can compare the current situation with the situation from a decade ago.
|
By adjusting this R script, you should be able to automate download and preparation of any type of MODIS products for your own mapping application. If you experience problems, please report them using the R-sig-geo mailing list, or start a discussion via this wiki.
Contents |
Installation of software
Before you can start downloading MODIS EVI images from R, you need to obtain and install some necessary packages and R libraries:
- RCurl --- allows you to list directories on an FTP server (read more);
- wget --- this will automate download of images from R; this exe you only need to put in your Windows directory folder (Note: make sure you disable your antivirus tools such as Norton or McAfee otherwise it might block wget from running);
- MRT --- MODIS reproject tool can be used to mosaic MODIS images, resample them to other coordinate systems, and export images to more common GIS formats;
After you have finished installing these two packages, you also need to specify the location of MRT and directory where you want to output all EVI maps you will produce:
UNIQ6af9a9af79c91377-geshi-00000000-QINU
Download of MODIS HDF tiles
MODIS images are typically distributed as HDF (Hierarchical Data Format) 10 by 10 arcdegree-tiles, projected in the Sinusoidal projection (Sinusoidal projection has been promoted by geographers as the most suited projection for global image databases; see e.g. Chang Seong et al., 2002), both HDF format and Sinusoidal projection are not supported in many GIS. Therefore, before you can use MODIS images, you will need to run some pre-processing to glue the tiles and coerce the data in a more usable format. We are interested to obtain monthly 1 km resolution MODIS EVI images (this dataset is known by the name "MOD13A3"), resample them to our local projection system (EPSG:3005), and then export them to a more common GIS format, namely GeoTiff.
The MOD13A3 tiles can be browsed/obtained directly via NASA's FTP server. We start by fetching the list of sub-directories (the dates) of interest:
UNIQ6af9a9af79c91377-geshi-00000001-QINU
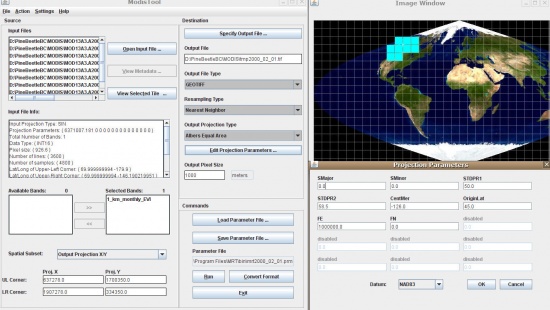
Next, we need to known the h/v position of the MODIS blocks. For example, we want to generate EVI images for the whole area of British Columbia. This area covers 9 MODIS tiles: h09v03, h09v04, h10v02, h10v03, h10v04, h11v02, h11v03, h12v02 and h12v03.
 Figure: MODIS tiling system in MRT. In order to see which blocks you need to cover your area of interest, use the MRTWeb tool, this MODIS Sinusoidal Grid shape file, and/or this Google Earth file. |
Each MODIS tile has an unique name. We can do a directory listing and get the full names of the tiles on the FTP by combining the getURL and grep methods:
UNIQ6af9a9af79c91377-geshi-00000002-QINU
This means that the directory "ftp://e4ftl01u.ecs.nasa.gov/MOLT/MOD13A3.005/2000.02.01/" contains a total of 1144 files. We wish to obtain only the names of the HDF files (9 tiles) for our area of interest. These can be obtained using the grep method:
UNIQ6af9a9af79c91377-geshi-00000003-QINU
note that we look only for the first (HDF) file. The second file with the same name is carries the production metadata (much about the HDF tile can be read already from the file name; see the MODIS Naming Conventions).
Next, we can download each tile using the download.file method, and with help of the wget package (you need to download the wget exe to your windows system directory, otherwise you will not be able to download the tiles from R):
UNIQ6af9a9af79c91377-geshi-00000004-QINU
By looping these operations, you can download any tile of interest (see also the original R script used).
Mosaicking and resampling
Once we have downloaded all tiles of interest, we can mosaic them into a single image. To do this, we use the MODIS Resampling Tool, that you should have already installed on your machine. We first generate a parameter file (this is simply a list of tiles that need to be glued):
UNIQ6af9a9af79c91377-geshi-00000005-QINU
and then run the MRT mosaicking tool using this parameter file:
UNIQ6af9a9af79c91377-geshi-00000006-QINU
where -s "0 1 0 0 0 0 0 0 0 0 0" is the definition of the spectral selection (2nd band is the EVI image; see also the complete layer specification), and 'TmpMosaic.hdf' is the temporary mosaic HDF image.
Next, we need to generate a MRT parameter file that can be use to resample the image to the target coordinate system NAD83 / BC Albers:
UNIQ6af9a9af79c91377-geshi-00000007-QINU
For more info about the structure and definition of variable used in the MRT parameter files see the MRT user's guide (Land Processes DAAC, 2008).
We do not need the complete image, but only values of EVI for our area of interest. In other words, we need to resample this mosaic using the resample exe of the MRT. This will reproject and cut this mosaic using:
UNIQ6af9a9af79c91377-geshi-00000008-QINU
Just to check that everything is ok:
UNIQ6af9a9af79c91377-geshi-00000009-QINU
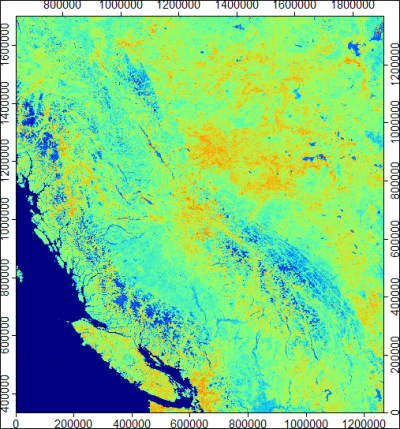
The final result of resampling is shown below. Note that the final image is only 3.4 MB big, although we have downloaded almost 100 MB of data.
To analyze such time-series data (in this case 108 EVI images) you should consider using some of the free-GIS tools e.g. ILWIS GIS, GRASS GIS, or similar.
FWTools / MODIS Web services
An alternative approach to read HDF images is by using the FWTools (courtesy of by Frank Warmerdam). With FWTools you can also automate reading and resampling of MODIS bands (most probably you will first need to export the HDF bands to some standard GDAL supported format e.g. geotiff, then resample or mosaic the images). As the input coordinate system you can try using:
"+proj=sinu +lon_0=0 +x_0=0 +y_0=0 +a=6371007.181 +b=6371007.181 +units=m +no_defs"
To work around to the Modis Reprojection Tool is to utilize FWTools to generate VRT (virtual mosaic) files by using the gdalbuildvrt functionality e.g.:
UNIQ6af9a9af79c91377-geshi-0000000B-QINU
This is an example suggested by Alex Villers.
There is also an (experimental) MODIS web service that provides a number of functions to fetch information about the MODIS data, e.g. getbands("MOD13Q1") will return the list of bands available for a product, and get a subset of the data. You can also download a subset of the MODIS products via a web-interface.
References
- Chang Seong, J., Mulcahy, K.A., Usery, E.L., 2002. The Sinusoidal Projection: A New Importance in Relation to Global Image Data. The Professional Geographer 54(2): 218-225.
- Huete, A., Didan, K., Miura, T., Rodriguez, E.P., Gao, X., Ferreira, L.G., 2002. Overview of the radiometric and biophysical performance of the MODIS vegetation indices. Remote Sensing of Environment, 83: 195–213.
- Land Processes DAAC, 2008. MODIS Reprojection Tool User’s Manual. USGS Earth Resources Observation and Science (EROS) Center, p. 61.
- Lunetta, R.S., Knight, J.F., Ediriwickrema, J., Lyon, J.G., Dorsey Worthy, L., 2006. Land-cover change detection using multi-temporal MODIS NDVI data. Remote Sensing of Environment, 105(2): 142-154
- Neteler, M., 2005. Time series processing of MODIS satellite data for landscape epidemiological applications. International Journal of Geoinformatics, 1(1), pp. 133-138.
- Ozdogana, M., Gutman, G., 2008. A new methodology to map irrigated areas using multi-temporal MODIS and ancillary data: An application example in the continental US. Remote Sensing of Environment, 112(9):3520-3537.
<Rating> Rate this article: 1 Poor and in error 2 Far from ready 3 Needs improvements 4 Minor corrections 5 Very useful!! </Rating>
