Who's onlineThere are currently 0 users and 11 guests online.
User loginBook navigationNavigationLive Traffic MapNew Publications
|
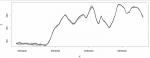
Fig. 10.5: 100 simulations of DEM showing using a cross-section from West to East.
library(maptools)
library(gstat)
library(geoR)
library(rgdal)
library(lattice)
library(RSAGA)

# MGI Balkans zone 6:
gk_6 <- "+proj=tmerc +lat_0=0 +lon_0=18 +k=0.9999 +x_0=6500000 +y_0=0 +ellps=bessel
+units=m +towgs84=550.499,164.116,475.142,5.80967,2.07902,-11.62386,0.99999445824"

# ------------------------------------------------------------
# Import of data to R:
# ------------------------------------------------------------

download.file("http://www.spatial-analyst.net/DATA/elevations.zip",
destfile=paste(getwd(), "elevations.zip", sep="/"))
for(j in list(".shp", ".shx", ".dbf")){
fname <- zip.file.extract(file=paste("elevations", j, sep=""), zipname="elevations.zip")
file.copy(fname, paste("./elevations", j, sep=""), overwrite=TRUE)
}
unlink("elevations.zip")
list.files(getwd(), recursive=T, full=F)

# import the map to R:
elevations <- readShapePoints("elevations.shp", proj4string=CRS(gk_6))
str(elevations)
names(elevations@data) <- "Z"

# ------------------------------------------------------------
# Variogram modelling:
# ------------------------------------------------------------

range(elevations$Z)
# sub-sample - geoR can not deal with large datasets!
sel <- runif(length(elevations@data[[1]]))<0.2
Z.geo <- as.geodata(elevations[sel,"Z"])
# histogram:
plot(Z.geo, qt.col=grey(runif(4)))
# Variogram modelling (target variable):
par(mfrow=c(1,2))
# anisotropy:
plot(variog4(Z.geo, max.dist=1000, messages=FALSE), lwd=2)
# fit variogram using likfit:
Z.svar <- variog(Z.geo, max.dist=1000, messages=FALSE)
Z.vgm <- variofit(Z.svar, messages=FALSE, ini=c(var(Z.geo$data), 1000), fix.nugget=T, nugget=0)
Z.vgm
# confidence bands:
env.model <- variog.model.env(Z.geo, obj.var=Z.svar, model=Z.vgm)
plot(Z.svar, envelope=env.model); lines(Z.vgm, lwd=2);
dev.off()

# spacing between contours:
bin.Z <- (max(elevations$Z)-min(elevations$Z))*(length(elevations$Z))^(-1/3)
round(bin.Z, 0)

# ------------------------------------------------------------
# Geostatistical simulations:
# ------------------------------------------------------------

# prepare an empty grid:
demgrid <- spsample(elevations, type="regular", cellsize=c(30,30))
gridded(demgrid) <- TRUE
fullgrid(demgrid) <- TRUE
demgrid@grid
gridcell <- demgrid@grid@cellsize[1]

# locs <- pred_grid(c(demgrid@bbox[1,1]+gridcell/2, demgrid@bbox[1,2]-gridcell/2),
c(demgrid@bbox[2,1]+gridcell/2, demgrid@bbox[2,2]-gridcell/2), by=gridcell)
# conditional simulations:
# Z.sims <- krige.conv(Z.geo, locations=locs, krige=krige.control(obj.m=Z.vgm), output=output.control(n.predictive=1))
# this is computationally very intensive; geoR is simply not fit to work with large data!

# copy the values fitted in geoR:
Z.ovgm <- vgm(psill=Z.vgm$cov.pars[1], model="Mat", range=Z.vgm$cov.pars[2], nugget=Z.vgm$nugget, kappa=1.2)
# *Kappa is artificially set at 1.2! to produce smooth surface!
Z.ovgm

# conditional simulations in gstat:
N.sim <- 100
DEM.sim <- krige(Z~1, elevations, demgrid, Z.ovgm, nmax=30, nsim=N.sim)
fullgrid(DEM.sim) <- TRUE
# plot 4 realizations:
spplot(DEM.sim[1:4], col.regions=grey(seq(0,1,0.025)))

# Cross-section at y=5,073,012:
cross.s <- data.frame(X=seq(demgrid@bbox[1,1]+gridcell/2, demgrid@bbox[1,2]-gridcell/2, gridcell),
Y=rep(5073012, demgrid@[email protected][1]))
coordinates(cross.s) <-~X+Y
# proj4string(cross.s) <- elevations@proj4string
cross.ov <- overlay(DEM.sim, cross.s)
plot(cross.ov@coords[,1], cross.ov@data[[1]], type="l", xlab="X", ylab="Z", col="grey")
for(i in 2:N.sim-1){
lines(cross.ov@coords[,1], cross.ov@data[[i]], col="grey")
}
lines(cross.ov@coords[,1], cross.ov@data[[N.sim]], lwd=2)
|
Latest image Testimonials"...Probably the only shared characteristic would be that these are things you can’t really get unmotivated people to grasp, but if someone is motivated, they’ll find their way in somehow. And enjoy it, after all, it is supposed to be fun, isn’t it?" PollRandom image; simulations using the same model (right).") |
 | Contact: Tomislav Hengl ([email protected]) |
Recent comments
9 years 2 weeks ago
9 years 19 weeks ago
9 years 28 weeks ago
9 years 40 weeks ago