The Stretch operation re-distributes values of an input map over a wider or narrower range of values in an output map. Stretching can for instance be used to enhance the contrast in your map when it is displayed. Two stretch methods are available: linear stretching and histogram equalization. For general information, see Stretch : functionality.
Linear stretching:
The input values of a map are re-scaled to output values in the output map.
Input values are specified by the 'stretch from' values; the lower and upper 'stretch from' boundary values are included in the stretching.
Output values are specified by the output domain and the value range and precision of this domain.
Linear stretching uses the following formula:
|
OUTVAL |
= |
(INVAL - INLO) * ((OUTUP-OUTLO)/(INUP-INLO)) + OUTLO |
where:
|
OUTVAL |
Value of pixel in output map |
|
INVAL |
Value of pixel in input map |
|
INLO |
Lower value of 'stretch from' range |
|
INUP |
Upper value of 'stretch from' range |
|
OUTLO |
Lower value of 'stretch to' range |
|
OUTUP |
Upper value of 'stretch to' range |
When the 'stretch from' range is specified as values, these are INLO and INUP.
When the 'stretch from' range is specified as a percentage (e.g. 1%), INLO and INUP are determined from the map's histogram (1% and 99% npcumpct); all input values smaller than or equal to INLO are brought to OUTLO, and all input values greater than or equal to INUP are brought to OUTUP.
When choosing output domain Image, then OUTLO is 0, and OUTUP is 255. When choosing domain Value, the minimum and maximum values specified as the value range are used as OUTLO and OUTUP ('stretch to' range).
The value specified as the precision of the output value domain is used to round OUTVAL.
The result of a linear stretch is that all input values are stretched to the same extent, see Fig. 1 below.

Fig. 1: Schematic explanation of a linear stretch. Input values range from 55 to 103; output values range from 0 to 255.
Histogram equalization:
Lower and upper boundaries of the 'stretch from' range are determined in the same way as with linear stretching. The 'stretch to' values are determined from the number of specified output intervals. When 256 intervals are specified, the output values will range from 0 to 255. When another number of output intervals is specified, the first interval will obtain output value 1, the second value 2, etc.
In this way all output intervals are filled with input values.
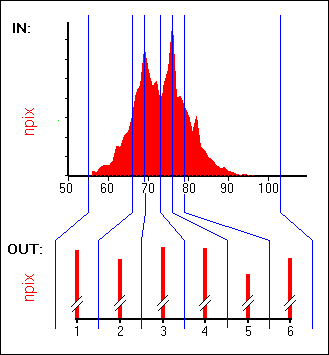
The result of a histogram equalization stretch is that parts of the histogram with many pixels are stretched more than parts with few pixels, see also Figure 2 below. Figure 3 below shows step 3 as described above: the determination of which input values belong to which output interval, in the histogram of an input map.

Fig. 2: Schematic explanation of a histogram equalization. Input values range from 55 - 103. Number of output intervals 6.

Fig. 3: Part of an input map's histogram showing the determination of which input values belong to which output intervals. The total number of pixels in this map was 187000. The threshold value for 6 groups, is thus 31166.67 pixels. Every time a multiple of this figure is reached in the histogram, a boundary is inserted; the value of the input map is closest to this threshold value is selected (66, 69, 73, 76, 79).
The first interval thus contains a total of 27236 pixels, the second interval 31223 pixels, the third interval 37520 pixels, the fourth interval 36168 pixels, the fifth interval 23244 pixels, and the sixth interval 31609 pixels.
See also: